Table DSL

From OS.bee documentation
Jump to: navigation, search

Documentation

Introduction

Vaadin

Vaadin is a web application framework for Java. In contrast to Javascript libraries and browser-plugin based solutions, Vaadin features a complete stack that includes a robust server-side programming model as well as client-side development tools based on GWT and HTML5.

More information:

https://vaadin.com/home

Vaaclipse

Vaaclipse is a framework for building web applications using Eclipse 4 Platform and Vaadin. It allows to use the power of the Eclipse 4 in web development. Vaaclipse moves the Eclipse Platform to Web using the rich web capabilities of Vaadin. You create your web application using Eclipse 4 features such as Eclipse Workbench, Application Model, Dependency Injection. You provide your own application parts using Vaadin widget library.

TableDSL

TableDSL generates the vaddin table ui.

The main semantic elements of the TableDSL are:

  • “package” - the root element that contains all the other elements. A model can contain multiple packages.
  • “import” declarations - used to import external models or even Java classes.
  • “table” - define the table configurations, e.g. refresh interval, row header mode, filter bar visible, etc.
  • “using datamart” - define the data source for this table .
  • “axis” - define the row/column configuration, e.g. row height, presort some elements of the table.
  • “details” - define row/column details, e.g. format , interval, tooltip, etc.
  • “value” - define the table value elements, it can be a measure of datamart, a derived measure of datamart, a level of cube, a property of datamart, an aggregation function of datamart, an ordinal column number of table, a column of datamart, taskId or allColumns of table.
  • “intervals - add interval property into Property Lookup Map of table.
  • “lookups” - add lookup property into Property Lookup Map of table.
  • “events” - define events for the table value elements in row/column in table.
  • “actions” - define actions and toolbar handlers for row/column of table.

Syntax

package definition

Syntax:

package <package name>  {
    import <import models/class name>
    ...

    table ... [using datamart <datamart name>
    {
        axis...[details{...}]
        [events{...}]
        [actions{...}]
    }]
    ...
}
table

Syntax:

table <table name> [described by <discription>] as grid [selectalways] [autowire] rowheader <row header mode name>  [polling <polling time number>] [filtering] [using datamart <datamart name>{...}]

Generate a <tablename>+Table.java file, in which a java class named <tablename>+Table extended from java class AbstractHybridVaaclipseView is defined. In this class, table and table configurations are defined.

For each action, generate a <tablename>+Handler+<actionname>.java, in which a java class <tablename>+Handler+<actionname> is defined. The methods in this file will be used as toolbar handlers by an Eclipse 4 application.

  • selectalways means the table value will be always selected. It sets following in createComponents():

Example 1:

tableSelectDelay.setRefreshInterval(1000);
if (tableSelectDelay.getListeners(null).size()==0) {
    tableSelectDelay.addListener(new 
    com.github.wolfie.refresher.Refresher.RefreshListener() {
        @Override
        public void refresh(final Refresher source) {
            // refresh only once
            source.setRefreshInterval(0);
            for(CellSetFilterTable table:tables) {
                if (table.getItemIds().size()>0) {
    table.select(table.getItemIds().iterator().next());
                }
            }
        }
    });
    workArea.addExtension(tableSelectDelay);
    }

Notes:

  • autowire means the value changing of table value will be send automatically as event.
    It sets table.setSelectable (true) and msg = new EventBrokerMsg(table.getValue()==null?null:dataSourceContainer.getStringValueByProperty((int) table.getValue(),"<entity id name>"),null);
    target = EventBrokerConstants.AUTOWIRED_ENTITY_PREFIX+"<entity name>"; eventBroker.send(target, msg); in createTable().
  • row header mode is including hidden, explicit and indexed. It is a vaadin configuration. table.setRowHeaderMode() will be set in createTable(). hidden means the row headers are hidden; explicit means item captains are explicitly specified; indexed means the index of the item is used as item caption.
  • polling time sets tableRefresher.setRefreshInterval as polling time number * 1000 ms in createView(). bpm
  • filtering sets table.setFilterBarVisible(true) in createTable().

Example 2:

table Employees described by "All Employees" as grid autowire rowheader hidden filtering using datamart Employees { . . .}
table TopProducts described by "Top products over advertising media" as grid selectalways rowheader hidden using datamart TopProductsByPromotionMediaShare {. . .}
table TaskInfo described by "Tasks" as grid rowheader indexed polling 5 filtering using datamart TaskInfo {. . .}
using datamart … { axis …}

Define a table according to datamart. Table row is the category axis; table column is the data axis.

Syntax:

using datamart <datamart name>{
    axis rows/columns [rowheight number]
    [preorder <table value element> [ascending] ]
    [details { . . .}]
    [events { . . .}]
    [actions { . . .}]
}

table value element:
  measure <datamart measure name> 
| derived <datamart derived measure name> 
| level <cube level name> 
| property <datamart property name> 
| aggregation <datamart set aggregation function name> 
| ordinal <number> 
| column <datamart column name> 
| taskId 
| allColumns

Notes:

  • row height could be only defined for axis rows , styles.add(".v-table-row-<rowStyle> {height: <rowHeight>px;}") and dataSourceContainer.setRowStyle(“<rowStyle>”) will be set in createTable().
  • preorder is available only for property of datamart. It will be set with dataSourceContainer.setSort(table, "<element name>", true/false) in createTable() for the table value element, if ascending, then set true.

Example:

axis rows rowheight 50
axis columns preorder column Priority
details

Define row/column details of the table, e.g. format, interval, tooltip, etc.

Syntax:

details {
    value <table value element> [collapse] [formatter <format string>] 
    [image path <path string> [dynamic] [hidelabel] [resize <size string>]] 
    [tooltipPattern <tooltip string>]
    [intervals [hidelabel] {
        up to <number interval value> <table range element>
        | days in past <date interval value> <table range element>
    }]
    [lookups [hidelabel] {
        number <lookup signed number> <table range element>
        | string <lookup string> <table range element>
        | days in past <lookup date number> <table range element>
    }]
}

table value element:
  measure <datamart measure name> 
| derived <datamart derived measure name> 
| level <cube level name> 
| property <datamart property name> 
| aggregation <datamart set aggregation function name> 
| ordinal <number> 
| column <datamart column name> 
| taskId 
| allColumns

table range element:
  textcolor <rgb string> 
| cellcolor <rgb string> 
| icon <icon string> 
| trend <trend icon> 
| tooltip <tooltip string>

Notes:

  • trend icon is including rising, bad-rising, sloping, good-sloping and stagnating.
  • ordinal <number> will be represent as #COLUMNS<number> . It is implemented for the cube, crosstable, in which the row name is not given.
  • allColumns will be represent as ?COLUMNS .
  • collapse will be set with propertyLookupMap.put("<element name>", new PropertyLookup().setCollapseColumn(true)) in createTable().
  • formatter will be set with propertyLookupMap.put("<element name>", new PropertyLookup().setFormat("<format string>")) in createTable().
  • image path will be set with propertyLookupMap.put("<element name>", new PropertyLookup().setImageService("<path string>", true/false)) in createTable(), if dynamic, then set true.
  • resize will be set with propertyLookupMap.put("<element name>", new PropertyLookup().setResizeString("<resize string>")) in createTable().
  • hidelabel will be set with propertyLookupMap.put("<element name>", new PropertyLookup().setHideLabel(true)) in createTable().
  • tooltipPattern will be set with propertyLookupMap.put("<element name>", new PropertyLookup().setTooltipPattern("<tooltip string>")) in createTable().
  • interval range with textcolor will be set with propertyLookupMap.put("<element name>", new PropertyLookup().addStyleInterval( <number>/<date>, "<style>" ))
    and styles.add(".v-table-cell-content-<style> {color: rgb(<rgb string>);}"); styles.add(".v-table-cell-content-<style>-odd {color: rgb(<rgb string>);}"); in createTable().
    interval range with cellcolor will be set with propertyLookupMap.put("<element name>", new PropertyLookup().addStyleInterval( <number>/<date>, "<style>" ))
    and styles.add(".v-table-cell-content-<style> {background-color: rgb(<rgb string>);}");styles.add(".v-table-cell-content-<style>-odd {background-color: rgb(<odd rgb string>);}"); in createTable(), e.g. rgb (0,128,128 )--> odd rgb (0,113,113), rgb (102,204,102 )--> odd rgb (87,189,87) .
    interval range with icon & trend <trend icon> will be set with propertyLookupMap.put("<element name>", new PropertyLookup().addResourceInterval(<number>/<date>, "<icon>.png/trend_<trend icon>.png")) in createTable().
    interval range with tooltip will be set with propertyLookupMap.put("<element name>", new PropertyLookup().addTooltipInterval(<number>/<date>, "<tooltip string>" )) in createTable().
    days in past will be represent as CXDate.add(new Date(), (long)-<number>, TimeUnit.DAYS).
    hidelabel will be set with propertyLookupMap.put("<element name>", new PropertyLookup().setHideLabel(true)) in createTable().
  • lookups range with textcolor will be set with propertyLookupMap.put("<element name>", new PropertyLookup().addStyleLookup( <number>/"<string>"/<date>, "<style>" )) and styles.add(".v-table-cell-content-<style> {color: rgb(<rgb string>);}")<code>;styles.add(".v-table-cell-content-<style>-odd {color: rgb(<rgb string>);}")</code>; in createTable().
    lookups range with cellcolor will be set with propertyLookupMap.put("<element name>"<code/>, <code>new PropertyLookup().addStyleLookup( <number>/"<string>"/<date>, "<style>" )) and styles.add(".v-table-cell-content-<style> { background-color: rgb(<rgb string>);}");styles.add(".v-table-cell-content-<style>-odd { background-color: rgb(<odd rgb string>);}"); in createTable(), e.g. rgb (0,128,128 )--> odd rgb (0,113,113), rgb (102,204,102 )--> odd rgb (87,189,87).
    lookups range with icon & trend <trend icon > will be set with propertyLookupMap.put("<element name>", new PropertyLookup().addResourceLookup(<number>/"<string>"/<date>, "<icon>.png/trend_<trend icon>.png ")) in createTable().
    lookups range with tooltip will be set with propertyLookupMap.put("<element name>", new PropertyLookup().addTooltipLookup(<number>/"<string>"/<date>, "<tooltip string>" )) in createTable().days in past will be represent as CXDate.add(new Date(), (long)-<number>, TimeUnit.DAYS).
    hidelabel will be set with propertyLookupMap.put("<element name>", new PropertyLookup().setHideLabel(true)) in createTable().
  • icons used in lookups: in case of enums, the icons are looked up in the bundle where the enum class is defined. The icon name shall have the complete path to the icon in the bundle. Eg. "enums/Gender/female.png". It is possible to use SVG as icon Format also.

Example:

details {
    value column TaskId collapse
}
details {
    value level StoreCountry lookups {
        string "Canada" icon "flag_canada"
        string "USA" icon "flag_usa"
        string "Mexico" icon "flag_mexico"
    }
}
details {
    value measure StoreSales formatter "###,##0.00"
    value derived PrevIncrease formatter "##0.0'%'" intervals {
        up to -3 trend sloping
        up to 3 trend stagnating
        up to 999 trend rising
    }
}
events

Syntax:

Define events for the table value elements in row/column in table. It works only with table autowire = true. It sends the table value element to the other views which including the datamart filter or referenced entity automatically when it changes the value. By now it is only available for ordinal column, aggregation, taskId and property.

events {
    broker <table value element> to {
        datamart <datamart definition> 
         [filter <filter string> | referenced <entity reference>]
    }
}

table value element:
  measure <datamart measure name> 
| derived <datamart derived measure name> 
| level <cube level name> 
| property <datamart property name> 
| aggregation <datamart set aggregation function name> 
| ordinal <number> 
| column <datamart column name> 
| taskId 
| allColumns

Notes:

  • datamart filter will be set with if(table.getValue() == null) {target = "<filter string>/clear";msg = new EventBrokerMsg(null, "*"); eventBroker.send(target, msg);}else{<codes according to table value element>} in createTable() valueChange().
  • datamart referenced will be set with if(table.getValue() == null) {target = "<package name>/<datamart name>/<entity name>/<reference name>/clear";msg = new EventBrokerMsg(null, "*");eventBroker.send(target, msg);}else{<codes according to table value element>} in valueChange() method in createTable().
Codes according to are defined as following:
  • ordinal <number> will be represent as will be set with target = "<filter string>"; msg = new EventBrokerMsg(null, null, dataSourceContainer.getStringValueByOrdinal((int) table.getValue(), <ordinal number>));eventBroker.send(target, msg); in createTable() valueChange() inside else{}.
  • Aggregation <aggregation function name> will be represent as will be set with target = "<filter string>"; msg = new EventBrokerMsg(null, null, dataSourceContainer.getStringValueByAggregate((int) table.getValue())); eventBroker.send(target, msg); in createTable() valueChange() inside else{}.
It is only for aggregations of cube.
  • taskId will be represent as will be set with target = "<filter string>"; msg = new EventBrokerMsg(null, null, dataSourceContainer.getTaskId((int) table.getValue()));eventBroker.send(target, msg); in createTable() valueChange() inside else{}.
It is only for BPM.
  • property <proterty name> will be represent as will be set with
target = "<filter string>"/"<package name>/<datamart name>/<entity name>/<reference name>"; msg = new EventBrokerMsg(null, null, dataSourceContainer.getStringValueByProperty((int) table.getValue(), <property name>)); eventBroker.send(target, msg); in createTable() valueChange() inside else{}.
Example:
events {
    broker taskId to {
        datamart TaskDetails filter "de/compex/foodmart/datamarts/TaskDetails/P11/P11"
    }
}
events {
    broker aggregation topcount to {
        datamart WarehouseFinance filter "de/compex/foodmart/datamarts/WarehouseFinance/Product/ProductCategory"
    }
}
actions

Define actions and toolbar handlers for row/column of table. It is only available for BPM. And the conditions functionality will be implemented later.

For each action of the table, a <tablename>+Handler+<actionname>.java file will be generated, in which a java class <tablename>+Handler+<actionname> is defined. The methods in this class will be used as toolbar handlers by an Eclipse 4 application.

actions {
    action Claim|Start|Stop|Release|Suspend|Resume|Skip|Complete|Delegate
        |Forward|Fail|Register|Remove|Activate|Exit [conditions {
        Condition 
            <table task operand>
           < | > | = | <= | >= | and | or | like
            <table task operand>
    }]
}
table task operand:
  <number> 
| <string> 
| column <datamart column name> 
| (      <number> | <string> | column <datamart column name>
    < | > | = | <= | >= | and | or | like
         <number> | <string> | column <datamart column name>
  )

Notes:

  • action <action string> will be set with List<String> items = new ArrayList<String>(); items.add("<action string>"); toolbarGenerator.createToolbar(thisPart, items, renderingEngine); in createToolbar() in xxxTable.java,
    and msg = new EventBrokerMsg(null, table.getValue()==null?null: dataSourceContainer.getStringValueByProperty((int) table.getValue(), "status"), table.getValue()==null?-1:dataSourceContainer.getTaskId((int) table.getValue()));target = EventBrokerConstants.TASK_STATUS_PREFIX+"
Table/"+"<action string>"</code>;eventBroker.send(target, msg);in createTable() valueChange() in xxxTable.java.

The following handler will be generated for external triggered task actions in createView() in xxxTable.java:

dispatchAction = new EventHandler() {
 @Override
 public void handleEvent(Event event) {
     EventBrokerMsg msg = (EventBrokerMsg)event.getProperty(EventUtils.DATA);
     log.debug("dispatch action received in <table name> for "+msg.getName());
     if ("Delegate".equals(msg.getName())) {
UI.getCurrent().addWindow(selectUserWindow.init(datamartClass.getBpmEngine(), eventBroker, EventBrokerConstants.TASK_DELEGATED, msg));
            
     } else {
     datamartClass.operations(msg.getLong(), null, Operation.valueOf(msg.getName()));
        }
    }
};
  • 4 methods canExecute(), execute(), subscribe() and unsubscribe() will be generated in xxxHandlerxxx.java for each action:
@CanExecute
public boolean canExecute() {
    if(status != null && status.equals(Status.<status name>)) {
      return true;
    }
    return false;
}

@Execute
public void execute(final IEventBroker eventBroker) {
    log.debug("task action execute called for <table name> <action name>");
    eventBroker.send(EventBrokerConstants.TASK_ACTION_PREFIX+"<table name>Table", new EventBrokerMsg(null, "<action name>", taskId));
}

@PostConstruct
protected void subscribe() {
    eventBroker.subscribe(EventBrokerConstants.TASK_STATUS_PREFIX+"<table name>Table/"+"<action name>", dispatchStatus);
}

@PreDestroy
protected void unsubscribe() {
    eventBroker.unsubscribe(dispatchStatus);
}

public TaskInfoHandlerClaim() {
    dispatchStatus = new EventHandler() {
        @Override
        public void handleEvent(Event event) {
            EventBrokerMsg msg = (EventBrokerMsg)event.getProperty(EventUtils.DATA);
            taskId = msg.getLong();
            if(msg.getName() == null) {
                status = null;
                log.debug("task action <table name> <action name> received status null");
            } else {
                status = Status.valueOf(msg.getName());
                log.debug("task action <table name> <action name> received status "+status.name());
            }
        }
    };
  }
  • The actions are according to the specific status as following:

Claim --> Status.Created

Start, Skip, Stop, Delegate, Forward, Register, Remove, Activate --> Status.Ready

Release, Suspend, Complete, Fail, Exit --> Status.InProgress

Resume --> Status.Suspended

Example:

actions {
    action Claim
    action Start
    action Stop
    action Complete
    action Suspend
    action Resume
    action Delegate
    action Release
    action Skip 
}

Example

The following examples show us how the table is defined, and how it looks like in Vaadin:

EmployeeSalary

Example:

package de.foodmart.tables {
    import de.compex.foodmart.datamarts.*

    table EmployeeSalary described by "Employee salary assignment" as grid 
    rowheader hidden filtering using datamart EmployeeSalary {
        axis rows details {
            value property gender lookups hidelabel {
                string "M" icon "enums/Gender/male.png"
                string "F" icon "enums/Gender/female.png"
                string "I" icon "enums/Gender/indifferent.png"
                string "M" tooltip "male"
                string "F" tooltip "female"
                string "I" tooltip "indifferent"
            }
        }
        axis columns details {
            value property salary formatter "###,##0.00" /* local national currency */ intervals {
                up to 5000 textcolor "204,102,102" /* dark red */
                up to 8000 cellcolor "0,128,128"
                up to 8000 textcolor "255,255,255" /* white */
                up to 10000 cellcolor "255,128,0"
                up to 100000 cellcolor "255,0,0" /* red */
                up to 100000 textcolor "255,255,255" /* white */
            }
            value property max_scale formatter "###,##0.00" /* local national currency */
            value property min_scale formatter "###,##0.00" /* local national currency */
            value property hire_date formatter "SHORTDATE" /* short date */
            value property marital_status lookups hidelabel {
                string "M" icon "enums/MaritalStatus/married.png"
                string "S" icon "enums/MaritalStatus/single.png"
                string "D" icon "enums/MaritalStatus/divorced.png"
                string "M" tooltip "married"
                string "S" tooltip "single"
                string "D" tooltip "divorced"
            }
        }
    }
}

Table name is EmployeeSalary, and it uses the datamart EmployeeSalary as data source, datamart EmployeeSalary is defined as following:

Example:

package de.compex.foodmart.datamarts {
    import de.compex.foodmart.entities.*

    import de.compex.foodmart.cubes.*
    /** datamart to show all relevant information about employee salary */
    datamart EmployeeSalary from CCNGDEFAULT persistenceUnit "foodmart" using
    entity Memployee {
        navigation {
            many to one
            Memployee.position to
            entity Mposition {
                properties {
                /** which position the employee has */
                    property position_title on axis rows
                    property max_scale on axis columns
                    property min_scale on axis columns
                }
                conditions {
                    condition
                    property pay_type
                    =
                    filtered
                }
            }
        }
        properties {
        /** the employees full name */
            property full_name on axis rows
            /** the date the employee was hired */
            property hire_date on axis columns
            /** flag for male/female */
            property gender on axis columns
            /** is the employee married */
            property marital_status on axis columns
            /** the actual salary */
            property salary on axis columns
            /** the education level the employee has reached */
            property education_level on axis columns
        }
        conditions {
            condition
            property education_level
            =
            filtered optional
        }
}

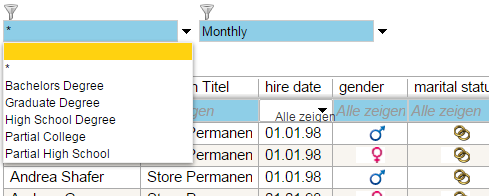
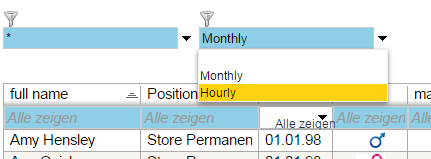
Pay type and education level are defined in datamart to be filtered:

Figure 1
Figure 2

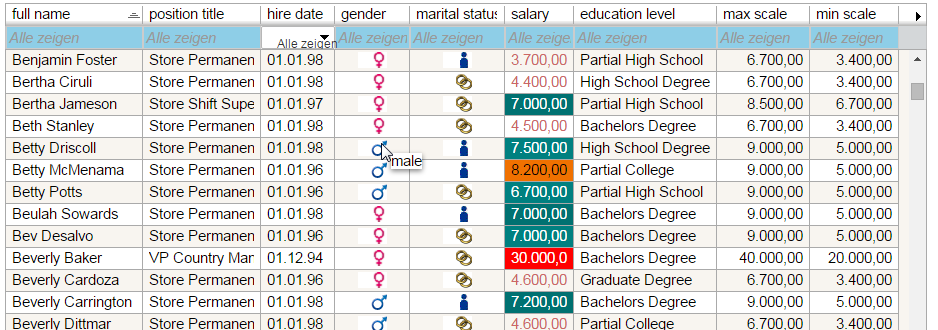
The whole table shows as following:

Figure 3

The row headers are hidden because of rowheader hidden is defined in table, and the filter is visible in table because of filtering is defined.

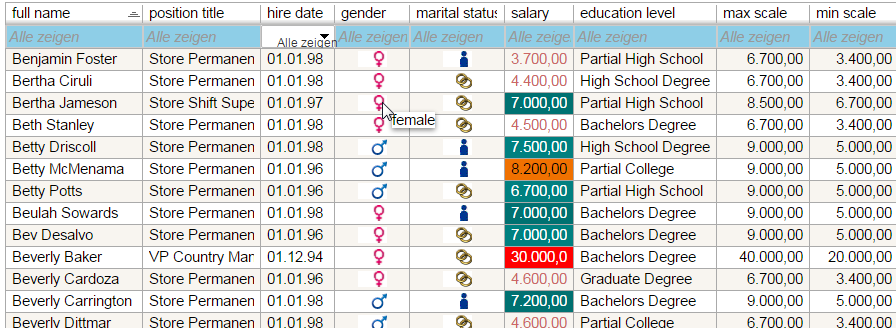
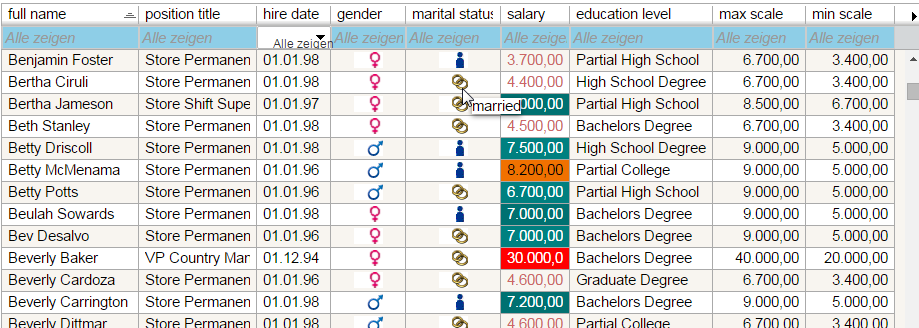
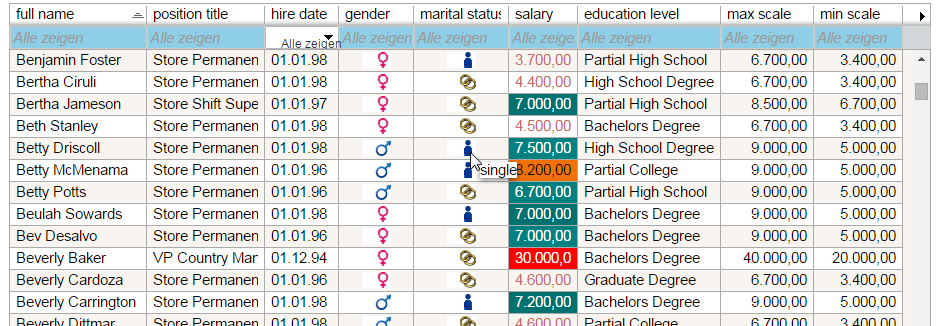
Gender and marital status are set with the icon and tooltip as definition; the salary is showed with the color and background color as definition; salary, max scale, min scale and hire date are all displayed with the format as definition:

Figure 4
Figure 5
Figure 6
Figure 7
TopProducts

Example:

package de.foodmart.tables {
    import de.compex.foodmart.datamarts.*

    table TopProducts described by "Top products over advertising media" as 
    grid selectalways rowheader hidden using datamart 
    TopProductsByPromotionMediaShare {
        axis rows
        events {
            broker aggregation topcount to {
                datamart WarehouseFinance filter "de/compex/foodmart/datamarts/WarehouseFinance/Product/ProductCategory"
            }
        }
        axis columns details {
            value allColumns formatter "##0.0'%'" intervals {
                up to 3 cellcolor "255,182,182" /* light red */
                up to 3 icon "notok"
                up to 10 cellcolor "102,204,102" /* light green */
                up to 10 icon "ok"
                up to 100 cellcolor "255,255,255" /* white */
            }
        }
    }
}

The table name is TopProducts. It uses the datamart TopProductsByPromotionMediaShare as data source, and automatically send event to datamart WarehouseFinace Filter by changing selected values of PorductCategory. Both datamarts are defined as following:

Example:

package de.compex.foodmart.datamarts {
    import de.compex.foodmart.entities.*
    import de.compex.foodmart.cubes.*

    datamart TopProductsByPromotionMediaShare described by "top products by sales over promotion media type" from CCNGDEFAULT persistenceUnit "foodmart" using
    cube Sales {
        derive MediaTotal from
        hierarchy PromotionMedia condensed
        over
        measure UnitSales
        derive MediaPerc from
        measure UnitSales
        /
        derived MediaTotal
        *
        100
        axis columns {
            hierarchy PromotionMedia level MediaType detailed ordered by
            derived MediaPerc
            descending
            derived MediaPerc
        }
        axis rows {
            topcount(15) of
            hierarchy Product level ProductCategory
            over
            measure StoreSales
        }
        slicer
        hierarchy StoreType level StoreType filtered
    }

    datamart WarehouseFinance described by "Warehouse financial data per product family" from CCNGDEFAULT persistenceUnit "foodmart" using
    cube Warehouse nonempty values {
        axis columns {
            measure StoreInvoice
            measure WarehouseSales
            measure WarehouseCost
        }
        axis rows {
            hierarchy Product level ProductCategory filtered
        }
        slicer
        hierarchy TheTime level Quarter filtered
        //        slicer

        //        hierarchy Warehouse level Country selected

        slicer
        hierarchy StoreType level StoreType selected
    }
}

This table is defined to be always selected by definition selectalways. And the row headers are hidden by definition rowheader hidden. All columns are set with the same format, and if the value of column is smaller as 3 then the cell color is light red and the “notok” icon will set directly after the value; if the value of column is between 3 and 10, then the cell color is light green and the “ok” icon will be set directly after the value; if the value of column is between 10 and 100, then the cell color is white.

Figure 8
TaskInfo

Example:

package de.foodmart.tables {
    import de.compex.foodmart.datamarts.*

    table TaskInfo described by "Tasks" as grid rowheader indexed polling 5 
    filtering using datamart TaskInfo {
        axis rows 
        events {
            broker taskId to {
                datamart TaskDetails filter "de/compex/foodmart/datamarts/TaskDetails/P11/P11"
            } 
        }
        actions {
            action Claim
            action Start
            action Stop
            action Complete
            action Suspend
            action Resume
            action Delegate
            action Release
            action Skip 
        }
        axis columns preorder column Priority details {
            value column TaskId collapse
            value column ProcessId collapse
            value column ActivationTime formatter "LONGDATE" /* long date */
            value column CreatedOn formatter "SHORTDATELONGTIME" /* short date long time */
            value column CreatedOn intervals {
                days in past 8 tooltip "very old"
                days in past 5 tooltip "old"
                days in past 1 tooltip "new"
                days in past -1 tooltip "actual"
            }
            value column CreatedOn intervals {
                days in past 10 textcolor "230,128,64" /* orange */
                days in past 7 textcolor "255,0,0" /* red */
            }
            value column Priority lookups hidelabel {
                number 0 icon "task_priority_0"
                number 1 icon "task_priority_1"
                number 2 icon "task_priority_2"
                number 3 icon "task_priority_3"
                number 4 icon "task_priority_4"
                number 5 icon "task_priority_5"
            }
            value column Status lookups hidelabel {
                number 0 icon "task_status_created"   
                number 1 icon "task_status_ready"  
                number 2 icon "task_status_reserved"  
                number 3 icon "task_status_inprogress"  
                number 4 icon "task_status_suspended"  
                number 5 icon "task_status_completed"  
                number 6 icon "task_status_failed"  
                number 7 icon "task_status_error"  
                number 8 icon "task_status_exited"  
                number 9 icon "task_status_obsolete"  
                number 0 tooltip "created"   
                number 1 tooltip "ready"  
                number 2 tooltip "reserved"  
                number 3 tooltip "in progress"  
                number 4 tooltip "suspended"  
                number 5 tooltip "completed"  
                number 6 tooltip "failed"  
                number 7 tooltip "error"  
                number 8 tooltip "exited"  
                number 9 tooltip "obsolete"  
            }
        }
    }
}

The table name is TaskInfo, and it uses the datamart TaskInfo as data source, datamart TaskInfo is defined as following:

Example:

package de.compex.foodmart.datamarts {
    import de.compex.foodmart.entities.*
    import de.compex.foodmart.cubes.*
    datamart TaskInfo described by "user tasks" from CCNGDEFAULT 
    persistenceUnit "foodmart" using
    task PotentialOwner usersEntity Memployee locale "de-DE" {
        columns {
            column TaskId
            column ProcessId
            column Priority
            column ActualOwner
            column Name
            column Subject
            column Status
            column ActivationTime
            column CreatedOn
        }
    }
}

The index of the item is used as item caption because of rowheader Indexd is defined in table, and the filter is visible in table because of filtering is defined. The refresh interval is defined as 5000ms.

Figure 9

9 actions are defined for this table, they are Claim, Start, Stop, Complete, Suspend, Resume, Delegated, Release and Skip:

Figure 10

Column TaskId and ProcessId could be collapsed as definition. The format of Action Time is defined as long date and the format of CreatedOn is defined as short date long time.

Figure 11

The Task which is Created On longer as 8 days is tipped as “very old”; inside 5 days is tipped as “old”; inside 1 day is tipped as “new”; and for the current date is tipped as “actual”. The text color is orange for the task created more than 10 days and red for the task created more than 7 days.

Figure 12
Figure 13
Figure 14

Different icons are set for column Priority and Status. And tooltips are also set for different status.

Figure 15

Copyright Notice

All rights are reserved by Compex Systemhaus GmbH. In particular, duplications, translations, microfilming, saving and processing in electronic systems are protected by copyright. Use of this manual is only authorized with the permission of Compex Systemhaus GmbH. Infringements of the law shall be punished in accordance with civil and penal laws. We have taken utmost care in putting together texts and images. Nevertheless, the possibility of errors cannot be completely ruled out. The Figures and information in this manual are only given as approximations unless expressly indicated as binding. Amendments to the manual due to amendments to the standard software remain reserved. Please note that the latest amendments to the manual can be accessed through our helpdesk at any time. The contractually agreed regulations of the licensing and maintenance of the standard software shall apply with regard to liability for any errors in the documentation. Guarantees, particularly guarantees of quality or durability can only be assumed for the manual insofar as its quality or durability are expressly stipulated as guaranteed. If you would like to make a suggestion, the Compex Team would be very pleased to hear from you.

(c) 2016-2024 Compex Systemhaus GmbH