OS.bee Business Analytics
Business Analytics
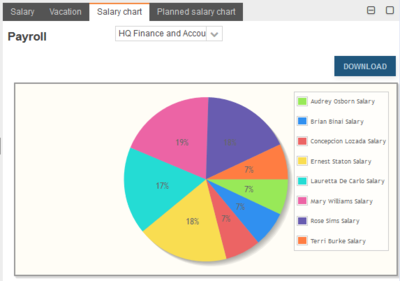
Store and hierarchically organize your business data bases as cube in multi-dimensional arrays. Evaluate your structured data on the required levels and represent the results in a table or as a chart: ready-to-use for your business reports.
Regardless of whether you would like your data base to be structured in three or more dimensions: With OS.bee Business Analytics, you´ll get the ability to individually configure a multi-dimensional data set and use it for your business purposes by evaluating it on required levels. In the next step, visualize the results as pie chart or table.
Technical Documentation


Copyright Notice
All rights are reserved by Compex Systemhaus GmbH. In particular, duplications, translations, microfilming, saving and processing in electronic systems are protected by copyright. Use of this manual is only authorized with the permission of Compex Systemhaus GmbH. Infringements of the law shall be punished in accordance with civil and penal laws. We have taken utmost care in putting together texts and images. Nevertheless, the possibility of errors cannot be completely ruled out. The Figures and information in this manual are only given as approximations unless expressly indicated as binding. Amendments to the manual due to amendments to the standard software remain reserved. Please note that the latest amendments to the manual can be accessed through our helpdesk at any time. The contractually agreed regulations of the licensing and maintenance of the standard software shall apply with regard to liability for any errors in the documentation. Guarantees, particularly guarantees of quality or durability can only be assumed for the manual insofar as its quality or durability are expressly stipulated as guaranteed. If you would like to make a suggestion, the Compex Team would be very pleased to hear from you.
(c) 2016-2026 Compex Systemhaus GmbH